Transaction tracing
The transaction tracing is useful to troubleshoot performance issues and get detailed low-level insight of how your app is working.
Slow HTTP calls are identified and the database and external calls are aggregated to understand why.
Enable the transaction tracing
The transaction tracing is disabled by default. On big infrastructure, you should only use the transaction tracing for a few days to collect informations and then disable it because there is no sampling and all requests are treated.
You’ll have to wait 10min to let PM2 Plus collects enough data.
@pm2/io
Enable the transaction tracing via the @pm2/io module.
const io = require('@pm2/io')

io.init({
  transactions: true // will enable the transaction tracing
  http: true // will enable metrics about the http server (optional)
})
PM2 CLI
When the transaction tracing is enabled, you’ll see a clock on the side of the process in the process list (pm2 ls).
Enable with:
pm2 reload <app_name> --trace
Disable with:
pm2 reload <app_name> --disable-trace
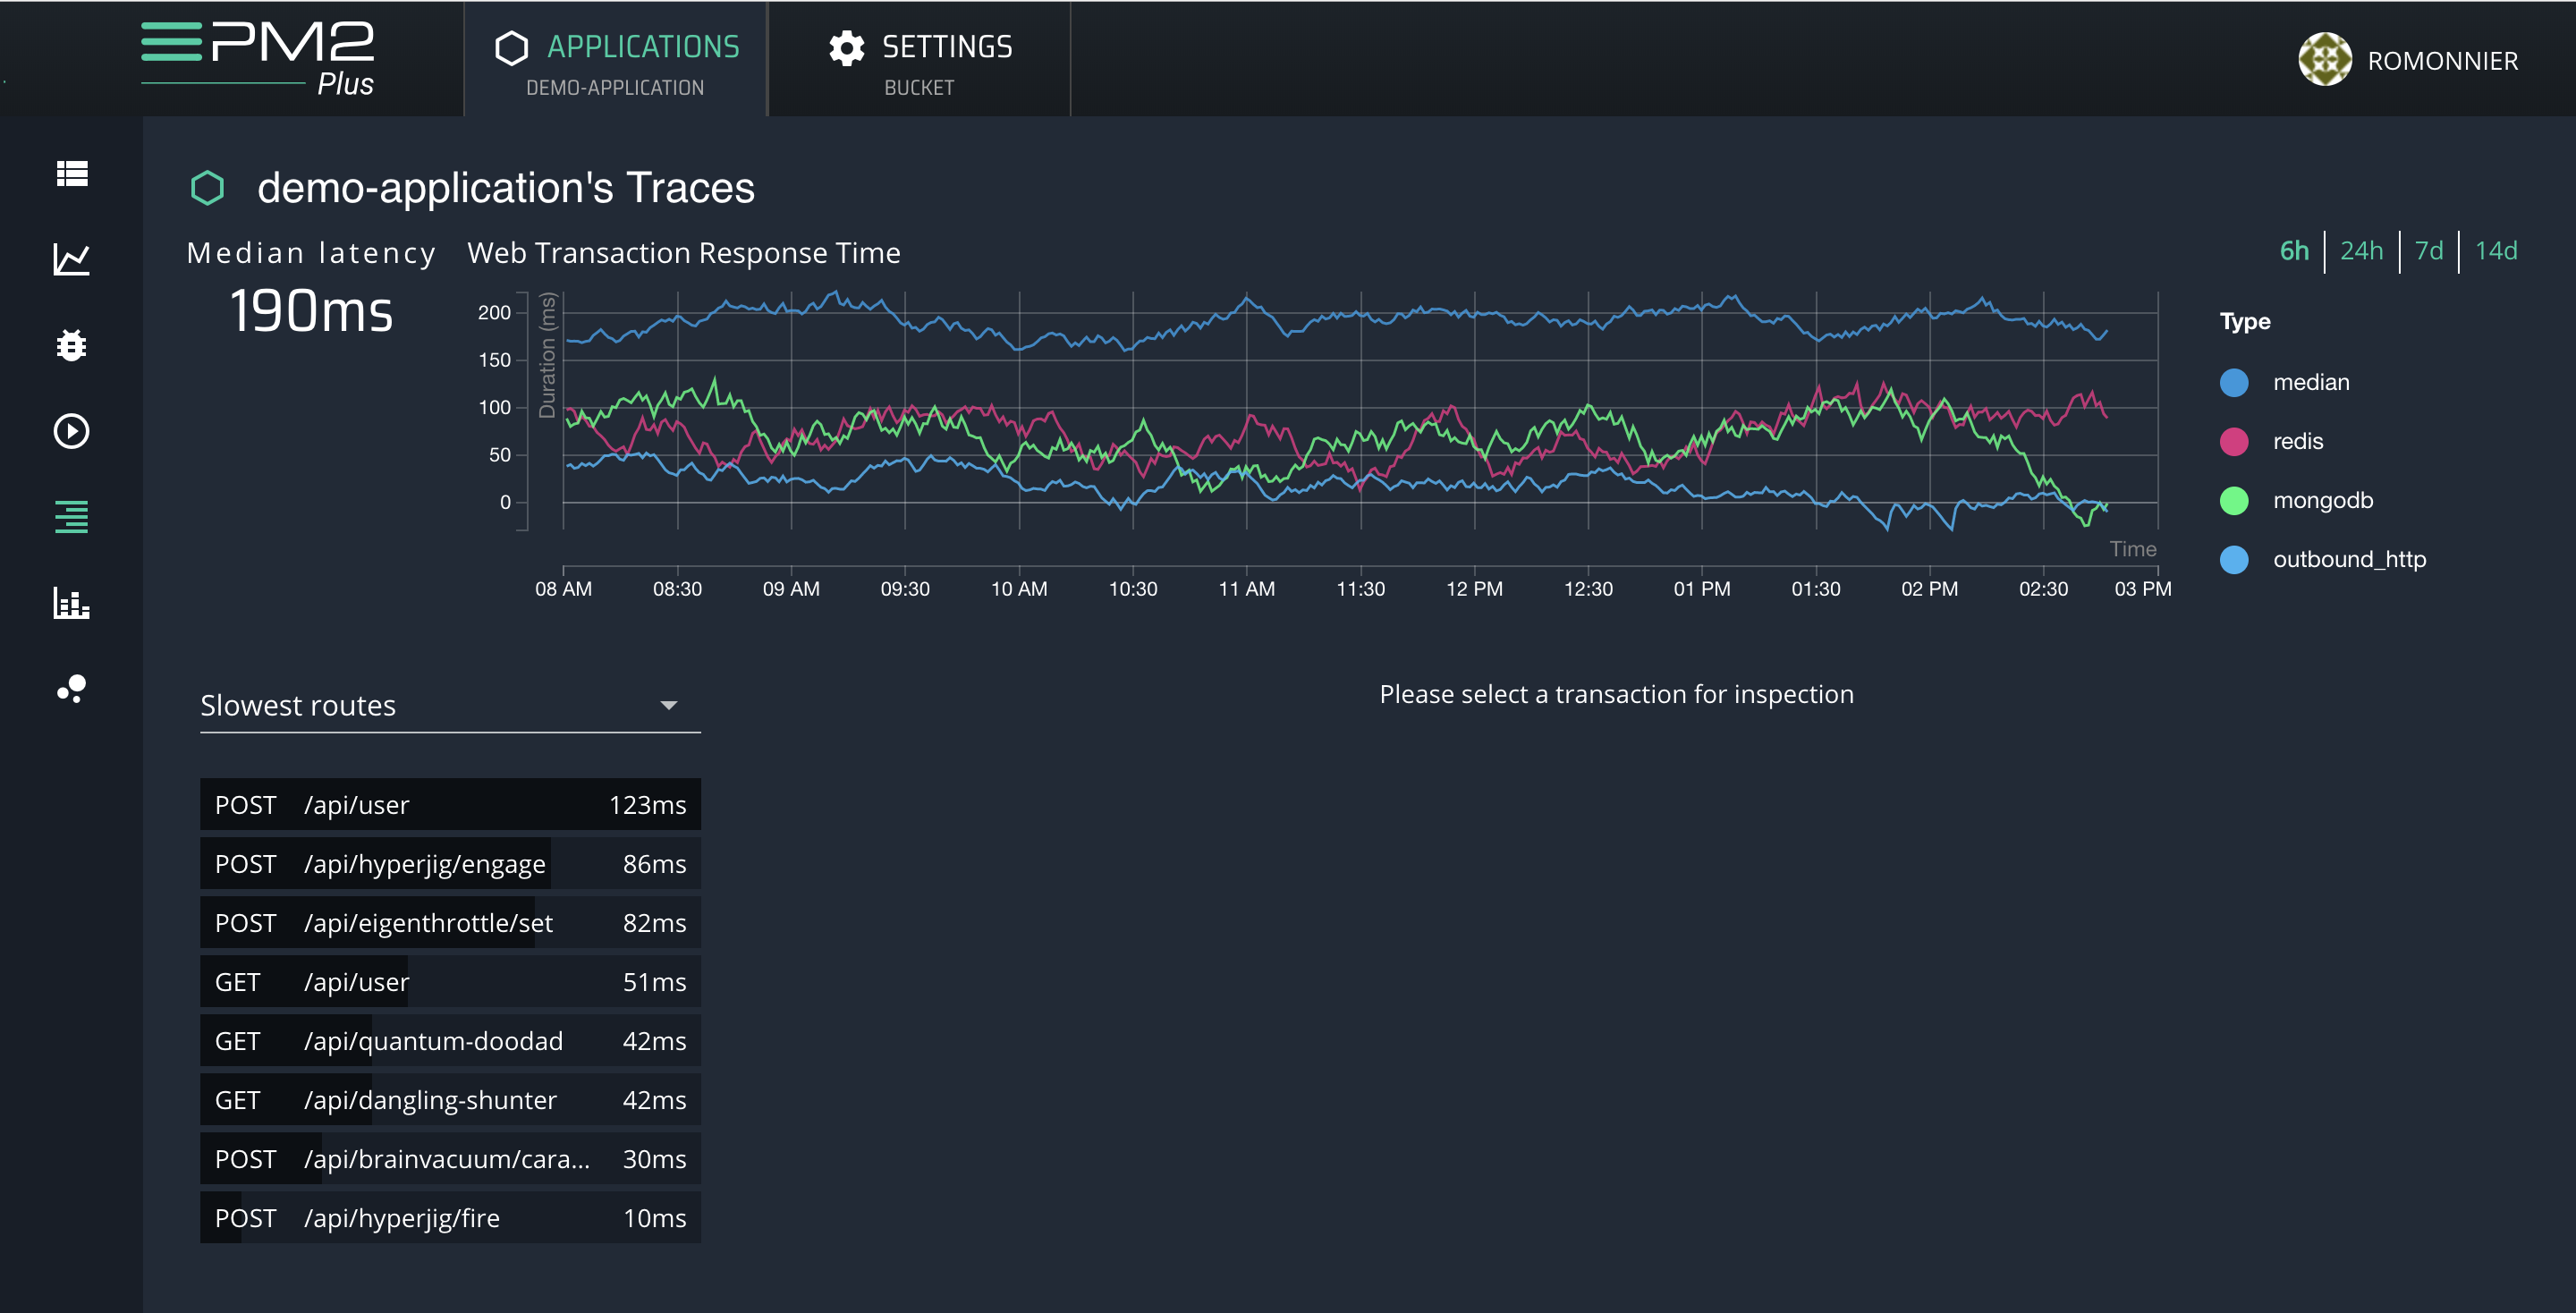
Transaction tracing dashboard
Latency graph
Under the graph you can select which values you want drawn on the graph:
- The median of the application tells you what an ordinary user can expect as a response time.
- P95 and P99 curves lets you explore the evolution of the slowest latencies of your application.
- The database latencies shows you how much time they consume in a standard request.
Transaction list
You can sort the recorded path of your app according to:
- Most time consuming: Total time spent in this route for the whole application
- Slowest routes: Which routes take the most time
- Number of calls: how many calls are made to every route
Transaction details and Variances
Some transactions have the same path but respond differently: a forbidden access on a route can return a 403 and be executed differently than usual. We call those variances: for each path we log up 5 most used variances that you can examine here.
Let’s examine a specific variance:
- median, slowest and fastest call response time
- Metadata about the call
- List of registered subcalls. If no call to an external entity is made, nothing will appear here. The call display and information depends on the stack logged. For databases, you will for example see the database call made.
You can then click on another variance to examine why and how the behaviour was different.
Under the hood
PMX will wrap below modules if they exist in your application:
expressversion 4hapiversions 8 - 13restifyversions 3 - 4koaversion v1.x- Outbound HTTP requests using
httpcore module mongodb-coreversion 1 (used by mongoose)redisversions 0.12 - 2mysqlversion ^2.9pgversion ^6.x
Then record all requests made or received by them then sended to PM2 Plus to be aggregated. The impact on performance should be low since there is no heavy logic done in your process except wrap modules and sending data.
Things to know
- When received by PM2 Plus, transactions are aggregated depending on their path (so without the query), for example:
/api/users/1and/api/users/2will be aggregated together because PM2 Plus detected the1and2has identifier/api/users/searchand/api/users/1will not be aggregated together becausesearchisnt a identifier
- PM2 Plus detect identifier with multiples regex:
- UUID v1/v4 with or without dash (
/[0-9a-f]{8}-[0-9a-f]{4}-[14][0-9a-f]{3}-[0-9a-f]{4}-[0-9a-f]{12}|[0-9a-f]{12}[14][0-9a-f]{19}/) - any number (
/\d+/) - suit of number and letter (
/[0-9]+[a-z]+|[a-z]+[0-9]+/): this one is used by mongo for document id - most SEO optimized webdocss (articles, blog posts…):
/((?:[0-9a-zA-Z]+[@\-_.][0-9a-zA-Z]+|[0-9a-zA-Z]+[@\-_.]|[@\-_.][0-9a-zA-Z]+)+)/
- UUID v1/v4 with or without dash (
- This feature has some known problems with other modules:
request-promise: clears the node cache and requires a new clean version of thehttpmodule. To solve this, requirehttpagain after requiringrequest-promiseto get the correctly wrappedhttpmodule.node-newrelic: works as we do, so you might encounter problems with it.