Webchecks
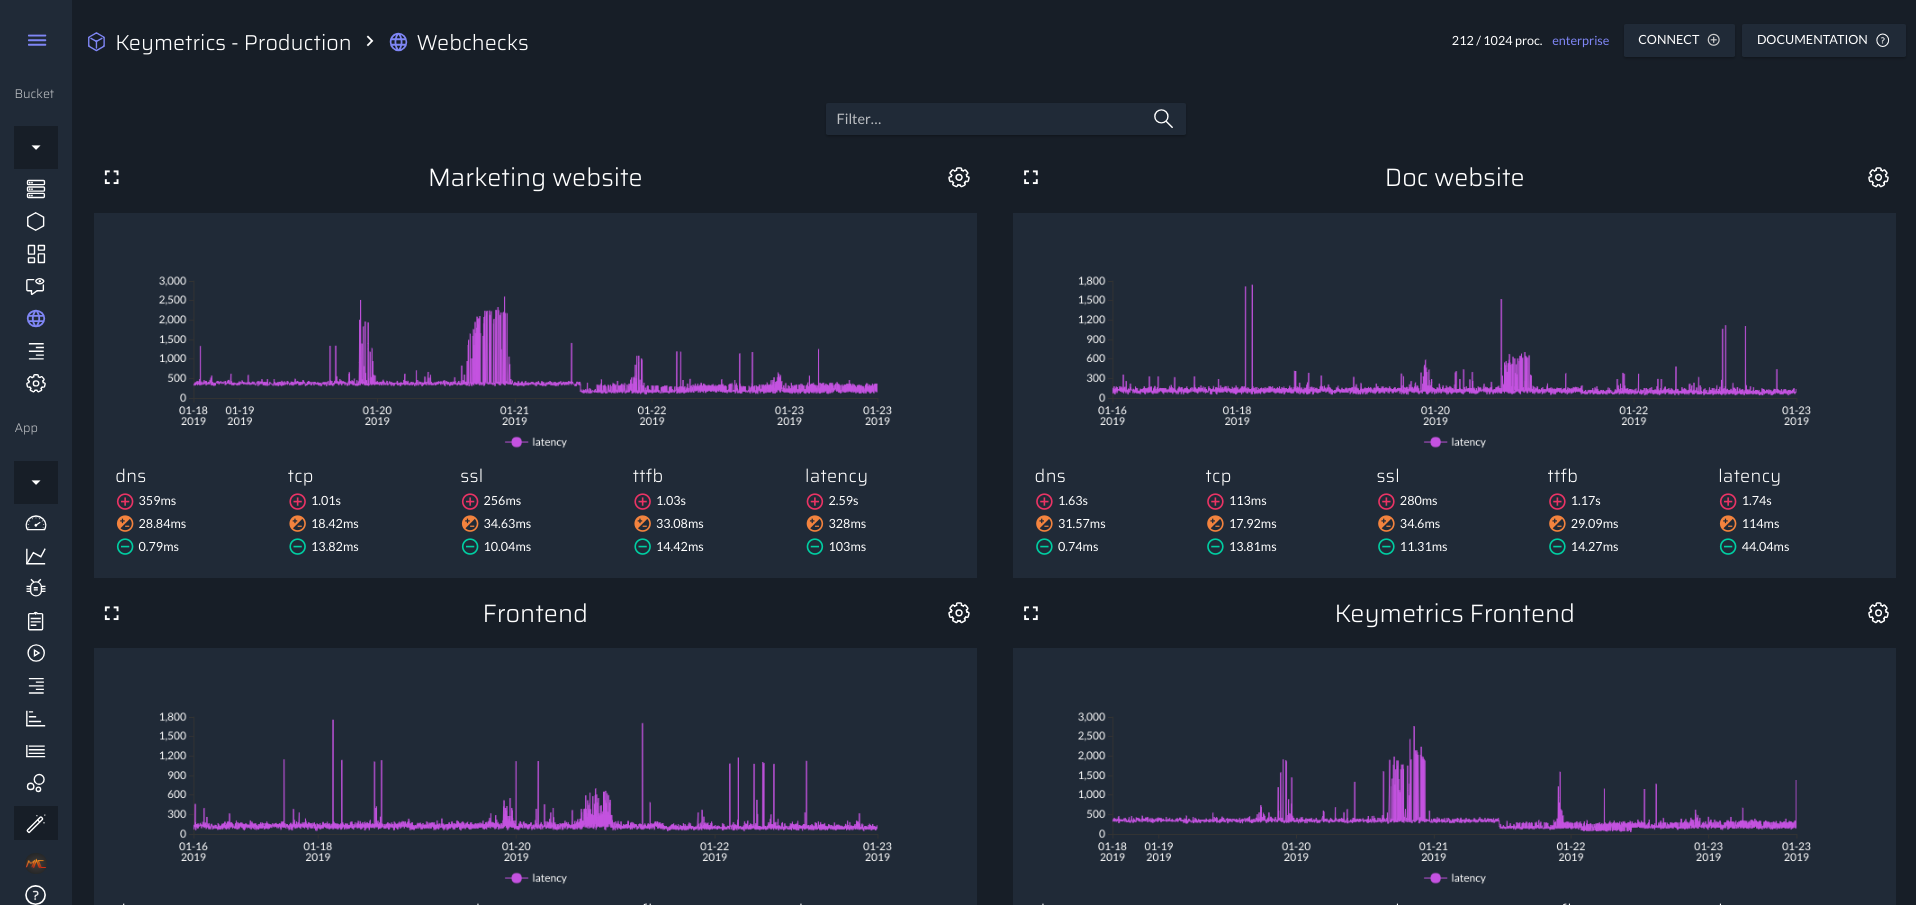
When monitoring your infrastructure, there are two paths: you can monitor from the inside or from the outside. The whole Enterprise product is mostly a monitoring tool that allows you to know what’s happening inside. The Webcheck feature helps you monitor your applications from the outside.
It allows you to configure any endpoint to be checked by our workers. It can be a http, https or tcp application. Of course like the alerting system, you are able to get alerted on few metrics like the latency of your application. You can also choose how and who will receive a notification.
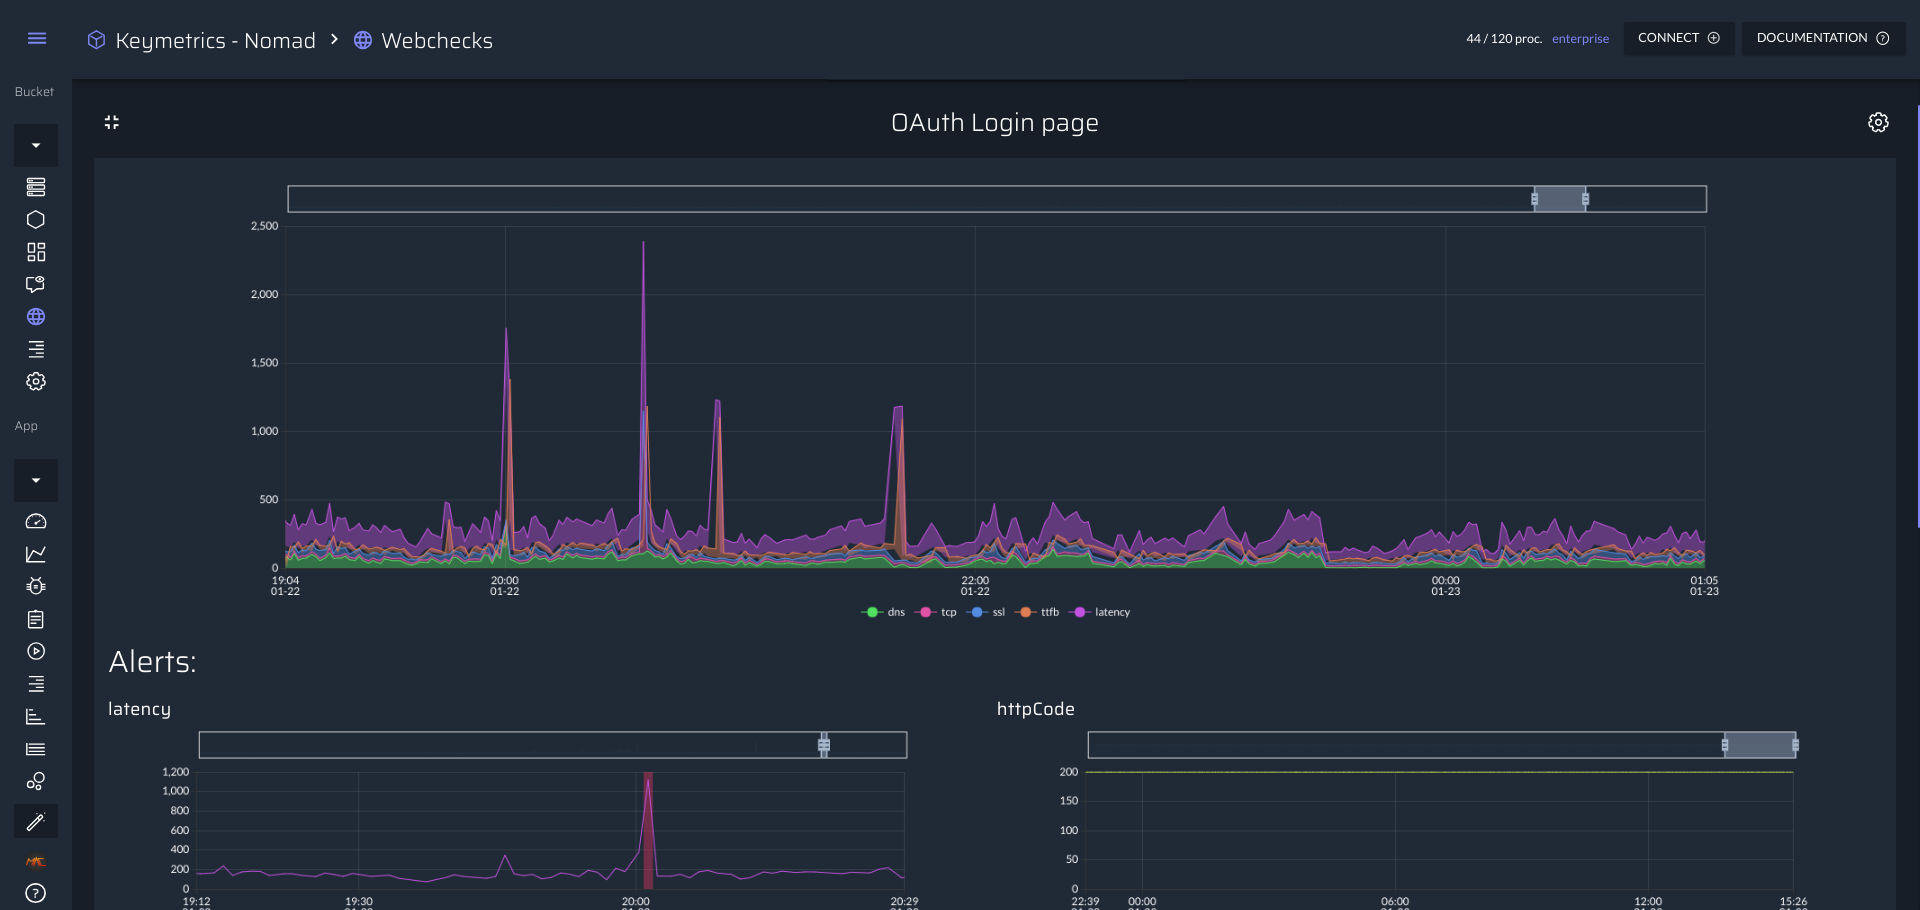
You can get the details of a webcheck by clicking on the zoom icon at the top left of each webcheck, you will then be able to check all metrics value over time:
Use cases
Verify Availability of your APIs
When providing API to your customers, you want to make sure they are available and not too slow. You can add a webcheck on specific routes and get alerted if they cross a specific threshold.
Know how much time it takes for your web app to load
When creating a webcheck, you can enable the toggle the Retrieve frontend metrics which will load your endpoint in a chromium browser to verify the time it takes to be interactive and few other key metrics for your users.
Requirements
In the following documentation, there are no specific requirements except that your endpoint need to be exposed to internet.
Configuration
When creating a webcheck, there are 3 main parts about the configuration:
General options
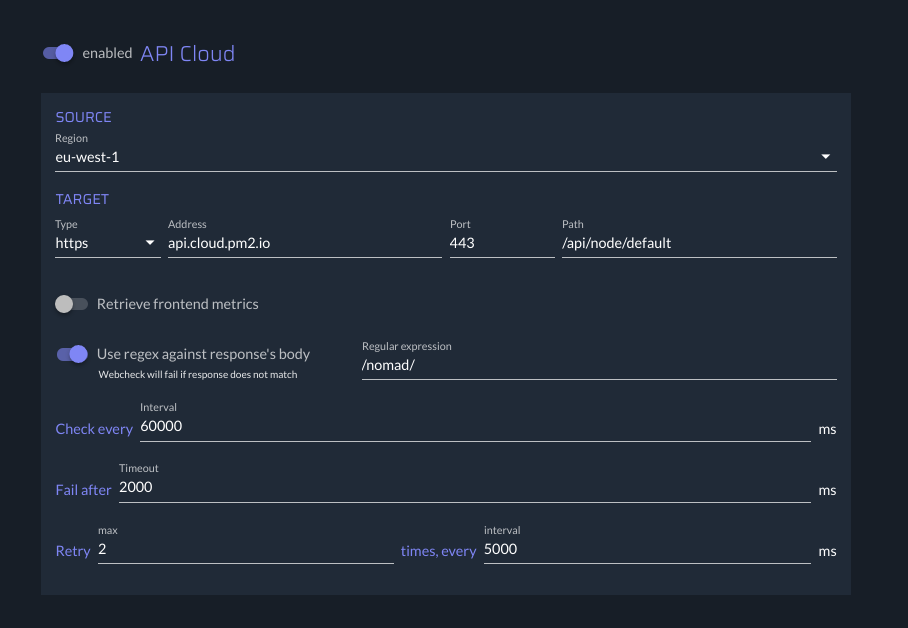
Those options are required to be able to schedule a webcheck, here a quick list of what you can configure:
Regionwhere we will be checking your endpoint from (we only offer 3 regions for now: EU, NA and India)Target: The endpoint to check (hostname,port etc)Type: it can be eitherhttps,httportcpRetrieve Frontend Metrics: If your endpoint is a web app (not an API), you can ask us to retrieve important metrics about it.Reponse Regex: You can verify that the response contains the right content with a quick regexCheck every: By default we will check every minutes but you can slow it down if you want.Fail after: Its the timeout, if we fail to connect to your endpoint after this duration, we will consider it as down.Retry&Interval: In case of failure, you might want to retry to be sure thats its down and not a bug.
Alerts options
When checking your endpoint, our system will produce few metrics on which you can add alert on, here a list:
Note: The state metric is the one thats representing the webcheck, if it’s at 0, the webcheck failed, otherwise it’s up.
| Name | Unit | Available on type | Frontend metrics only | Description |
|---|---|---|---|---|
| state | http,https,tcp | false | The result of the webcheck is represented by the state metric, which can be either 0 or 1. | |
| dns | ms | http,https | false | How much time it takes to fetch the dns record associated with the domain |
| httpCode | http,https | false | The actual HTTP code that the endpoint answer when the webcheck make a request. | |
| latency | ms | http,https,tcp | false | Overall latency to receive the whole content of the answer (contains dns, tcp handshake etc) |
| ssl | ms | http,https | false | Time used to make the TLS handshake between the client and the server |
| tcp | ms | http,https,tcp | false | Time used to make the TCP handshake between the client and the server |
| ttfb | ms | http,https,tcp | false | How much time the client waited for the first byte of the request’s content |
| firstMeaningfulPaint | ms | http,https | true | How much time the user waited to see website rendered in his browser |
| domInteractive | ms | http,https | true | How much time the user need to wait before interact in his browser |
| domProcessing | ms | http,https | true | Time used to process DOM by the browser |
| docsRendering | ms | http,https | true | Time used to render the docs from the ttfb |
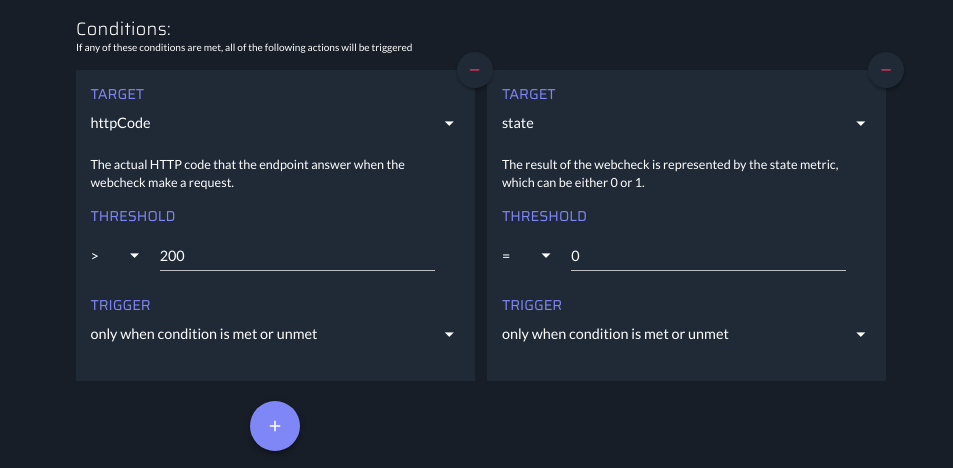
Like in the Alerting feature, you can setup a custom threshold depending on the metric.
By default we only send an alert when value cross the treshold (and not everytime it’s above it), you can change it via the Trigger configuration of each alert.
Actions options
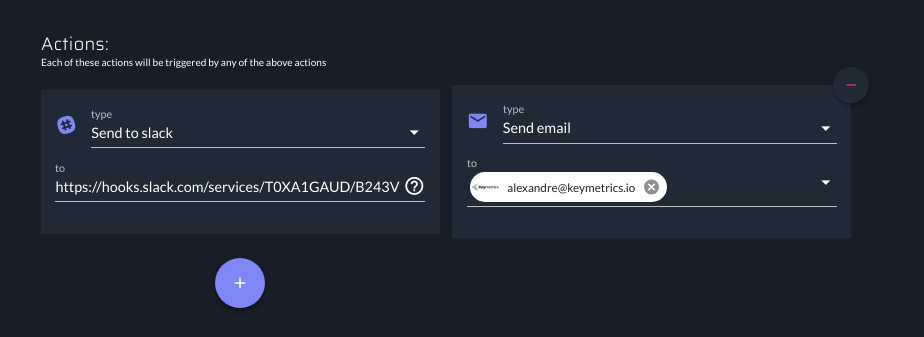
And finally, we allow you to configure exactly how you will receive an alerts for your webcheck. Here the list of available way to be alerted:
- Slack
- Webhook
If you insterested in more actions output (like Pagerduty), please contact us (sales@keymetrics.io)
Common Questions
-
Can i send different actions depending on the alert?
No, we don’t currently aim to implement this possiblity to keep the feature relatively simple.
-
I want to have another metrics like
We are totally open to implement other components, please contact us so we can discuss that !
Common Issues
-
The overview is slow to load
We are currently working on optimizing the fetching of metrics so it can be faster.