Overview
The alerting engine of PM2 Enterprise allows you to set alerts on metrics and receive alerts, like it’s possible with other monitoring solution. However we do a somethings more, which intregrating with our APMs:
- You can trigger a profiling of any application (either the cpu or memory) that allows you to continuously profile your application, across release to increase performance or detect regression.
- You can run a function in your application (with the custom actions)
- You can ask PM2 to restart your application (with you use the pm2 agent)
You currently support 3 ways to be alerted:
- Slack
- Webhook
Use cases
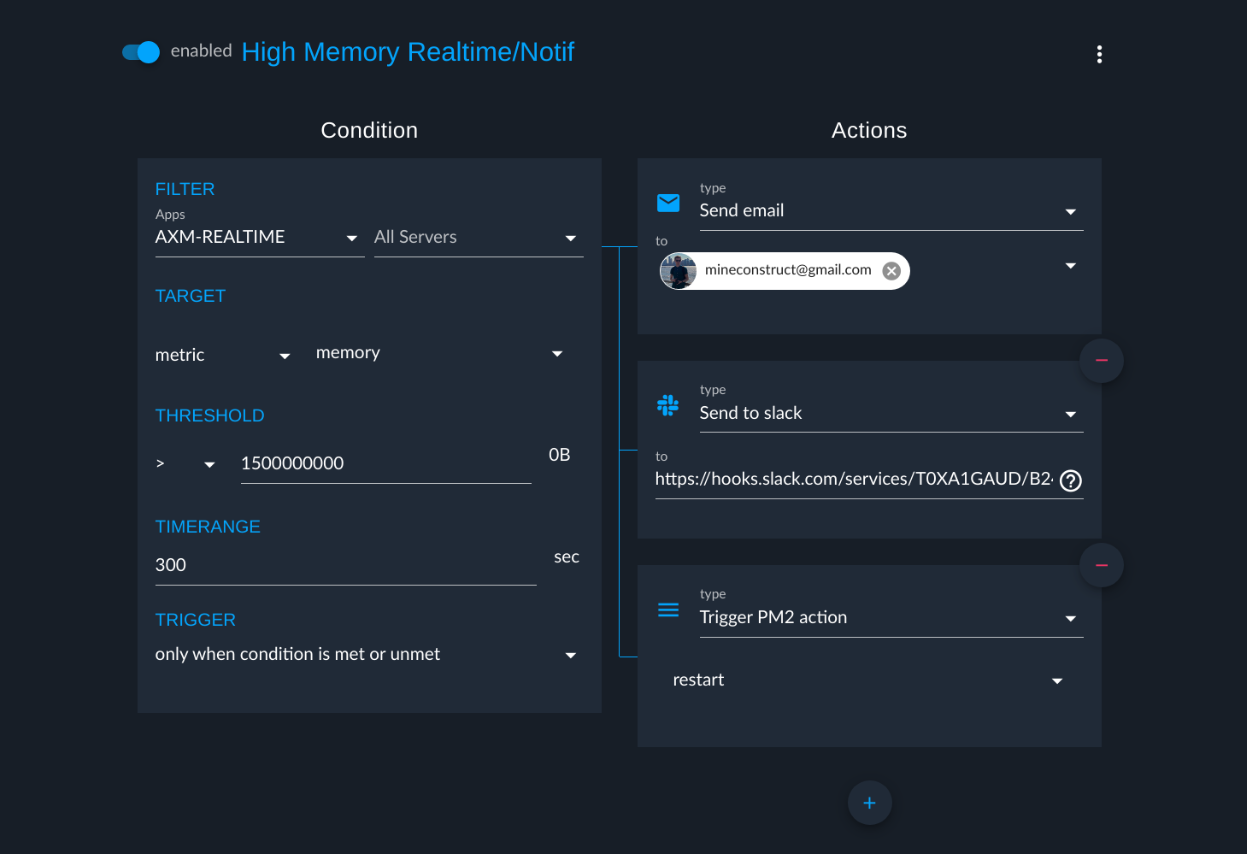
Be alerted when a metrics go above a threshold
The main use case of the feature is of course to alert you when metrics aren’t normal. A basic alert should looks like that:
- Create an alert
- Select the metric that you want to get alerted on
- Set the threshold
- Filter the app/server depending on which app you want to trakck
- Select an action to alert you that the threshold has been crossed (slack or email for ex.)
- Save it
Profile your application automatically
Given an example where you have a cpu spike in the night hours but doesn’t know why, you can explose your code base to try to understand it. You could also stay up late to run the profiling manually when the cpu spike. Or you could use the Alerting with the Profling to do that for you:
- Create an alert when the cpu usage goes above 70%
- Select as action the CPU Profile
- Set the duration at 30 secondes (should be enough)
- Select another action to alert you that the threshold has been crossed (slack or email for ex.)
- Save it
When you will receive a notification, just check in the CPU Profile panel, you should have your profile that have been stored for you. You can either download it or see it in the profiling inspector.
Restart your application if you know that somethings in wrong
Given an example where your app leaks memory but you don’t have the time to inspect it right now. You can just ask PM2 to restart it with the Alerting:
- Create an alert when the memory usage goes above 500M
- Filter the app/server depending on which app you want to restart
- Select a PM2 action as action to perform
- Set the action name to
restartorreload - Select another action to alert you that the threshold has been crossed (slack or email for ex.)
- Save it
Your application will now be automatically restarted and you will receive an alert when it’s done.
Requirements
In the following documention, we assume that you already have connected your application to PM2 Enterprise (either on-premise and cloud). We also assume that you know how custom metrics and customs actions works.
Configuration
This feature allow to get alerted when a metric goes above a specific treshold that you configured. You can configure different conditions to trigger the alert:
- Metric: Choose the metric value that will be watched
- Operator: Choose the operator that the value will be checked against (available: > < = <= =>)
- Treshold: Choose the value to not go above or under
- Window: Choose how much time we will use the compute the average from
- Application Name: only trigger for application with a specific name
- Server Name: only trigger for application that are in a specific server
When a alert is triggered, you can choose different Actions to run:
- Send an email: Choose the people in your bucket to send the alert to
- Send a slack message: Set the webhook URL used to post the message
- Send a webhook: Set the URL used to post the message
- Run a custom action: Trigger a custom action inside the application that triggered the alert
- Run PM2 action: Trigger a PM2 action (restart, reload etc) on the process that triggered the alert
- Profile CPU: You can ask the alerting to profile your application cpu usage, it will store the result for you to be able to inspect it later.
- Profile Memory: You can ask the alerting to profile your application memory application, it will also be stored.
Note: You can add actions as much as you want, they will all be run. Note that they are all launched in parralel and don’t respect any order.
Common Questions
-
If I choose a custom action, where will it be run?
The alerting engine will send the custom action do all processes that have gone above the treshold automatically, you can’t configure which process will receive it or not.
-
I filter by the application name and i received multiples emails at the same time for the same name, how is that possible?
If you have an application is on multiple server or even if the application is in cluster mode, you will receive an different alert for each process on every server that match the alert’s condition.
-
Can I do a specific query like in Graphana for example?
No and currently we don’t plan to make our engine more customizable.
Common Issues
-
It didn’t trigger an alert when it should have done !
The worker that check for metric that goes above a specific threshold use the
windowto compute the average, it may have been too big to get a average above the treshold, you should try lowering it. Note that the minimum window is60seconds.