Presentation
There are 2 types of overview in PM2 Plus, the first one is the Application overview where you don’t see any reference to a server in the overview, this one is mainly useful to containers or environment with a lot of applications.
The other one is the Server overview which is the default with PM2 Plus, it’s more detailed than the other one and show you every information by physical server.
Server Overview
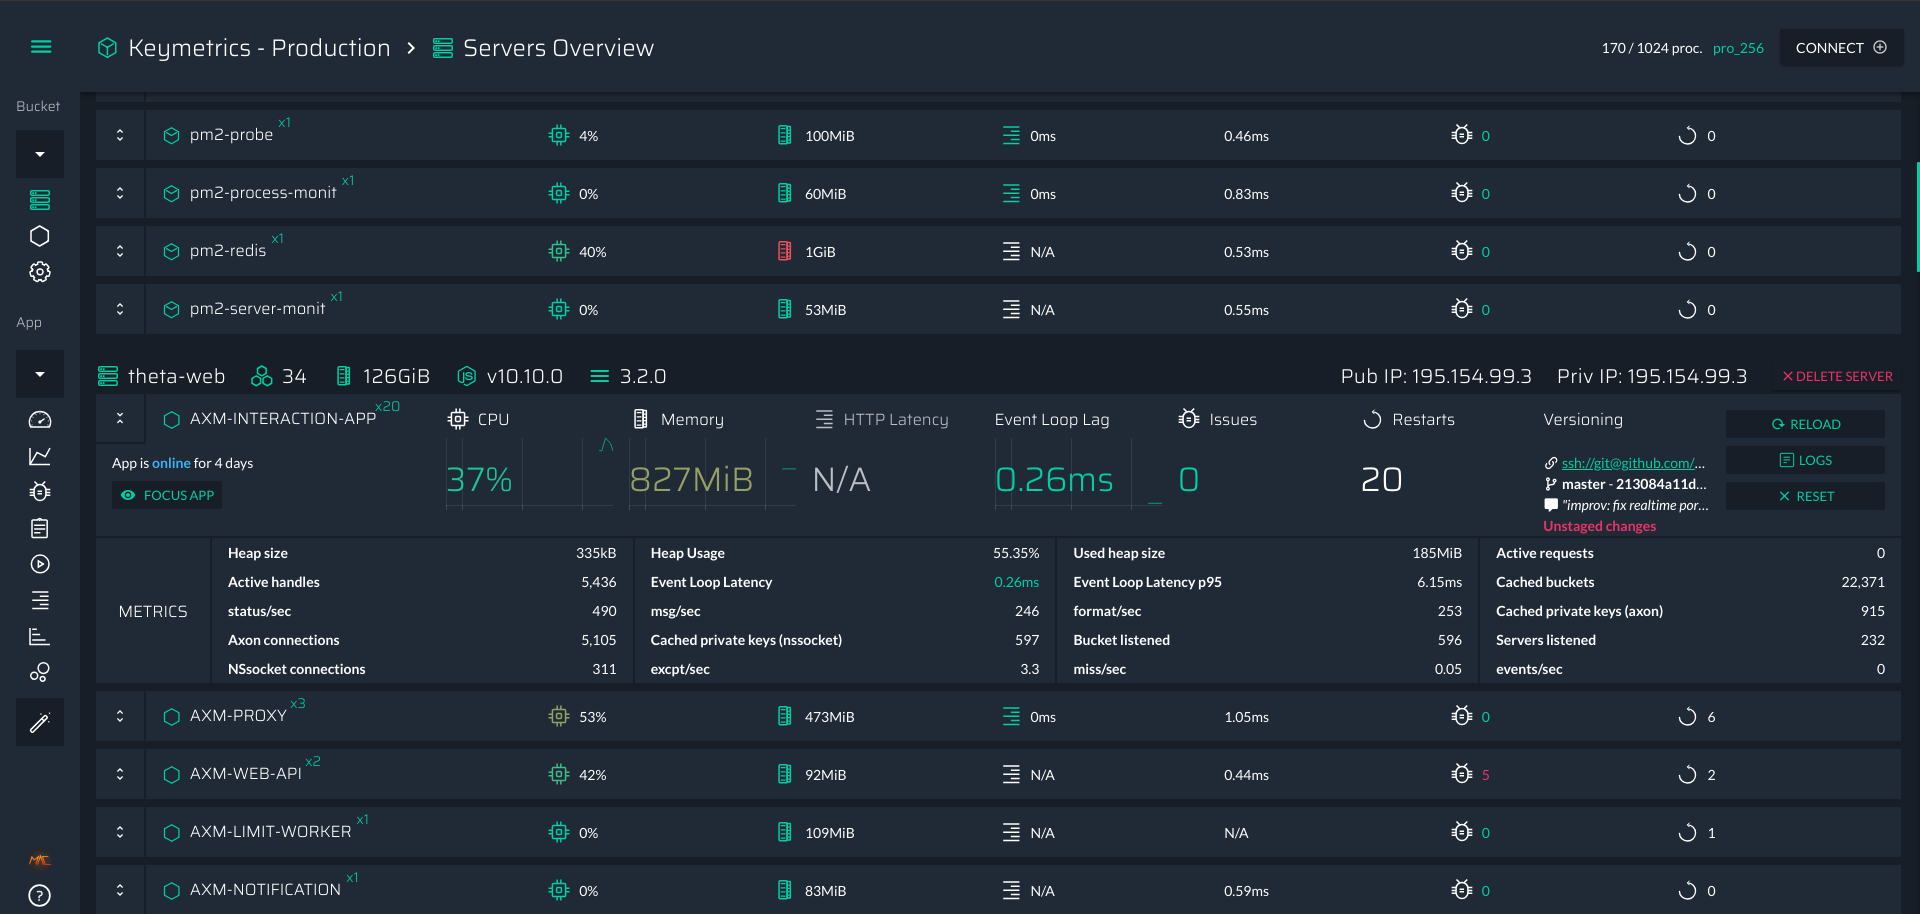
This view is breakdown by server, in the following example we have one server with 7 applications:
In the top bar of this section you will find infos about the actual server
- The Server’s Name
- Number of cores and memory
- Versions of Node.js & PM2
- The public and private IP
You are able to get realtime infos about any application such as
- cpu utilization
- memory comsumption
- HTTP Latency
- Issues
- Event Loop Lag (the amount of time between two run of the event loop, should be less than 10 ms)
- Number of restarts
- Versionning metadata (if your app is in a git repository)
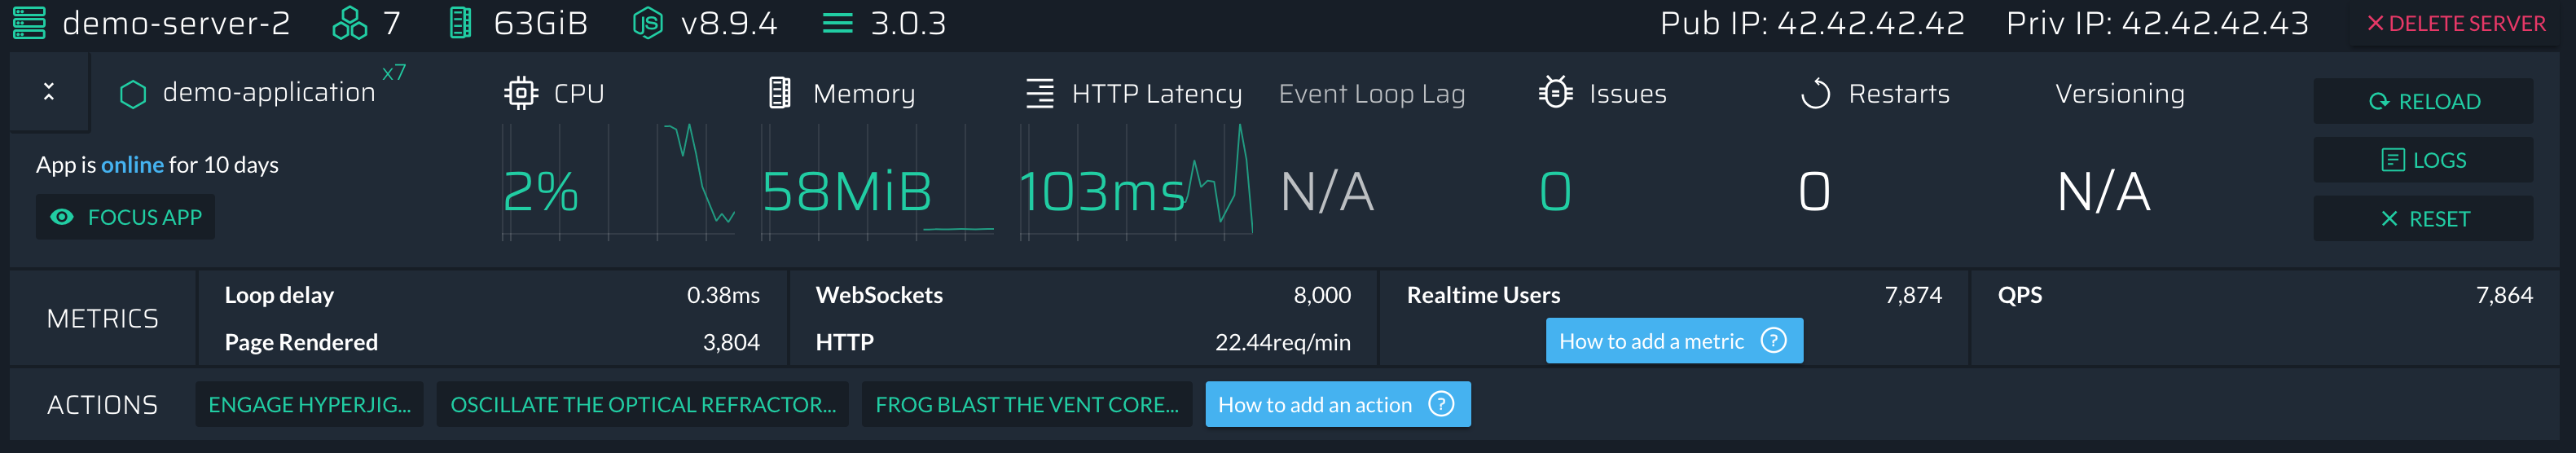
At the left of each application you can toggle more information for the application, it will show you:
- All the metrics about the applications (both default and custom ones)
- All the custom actions you added, you can trigger them for these buttons too.
Apps Overview
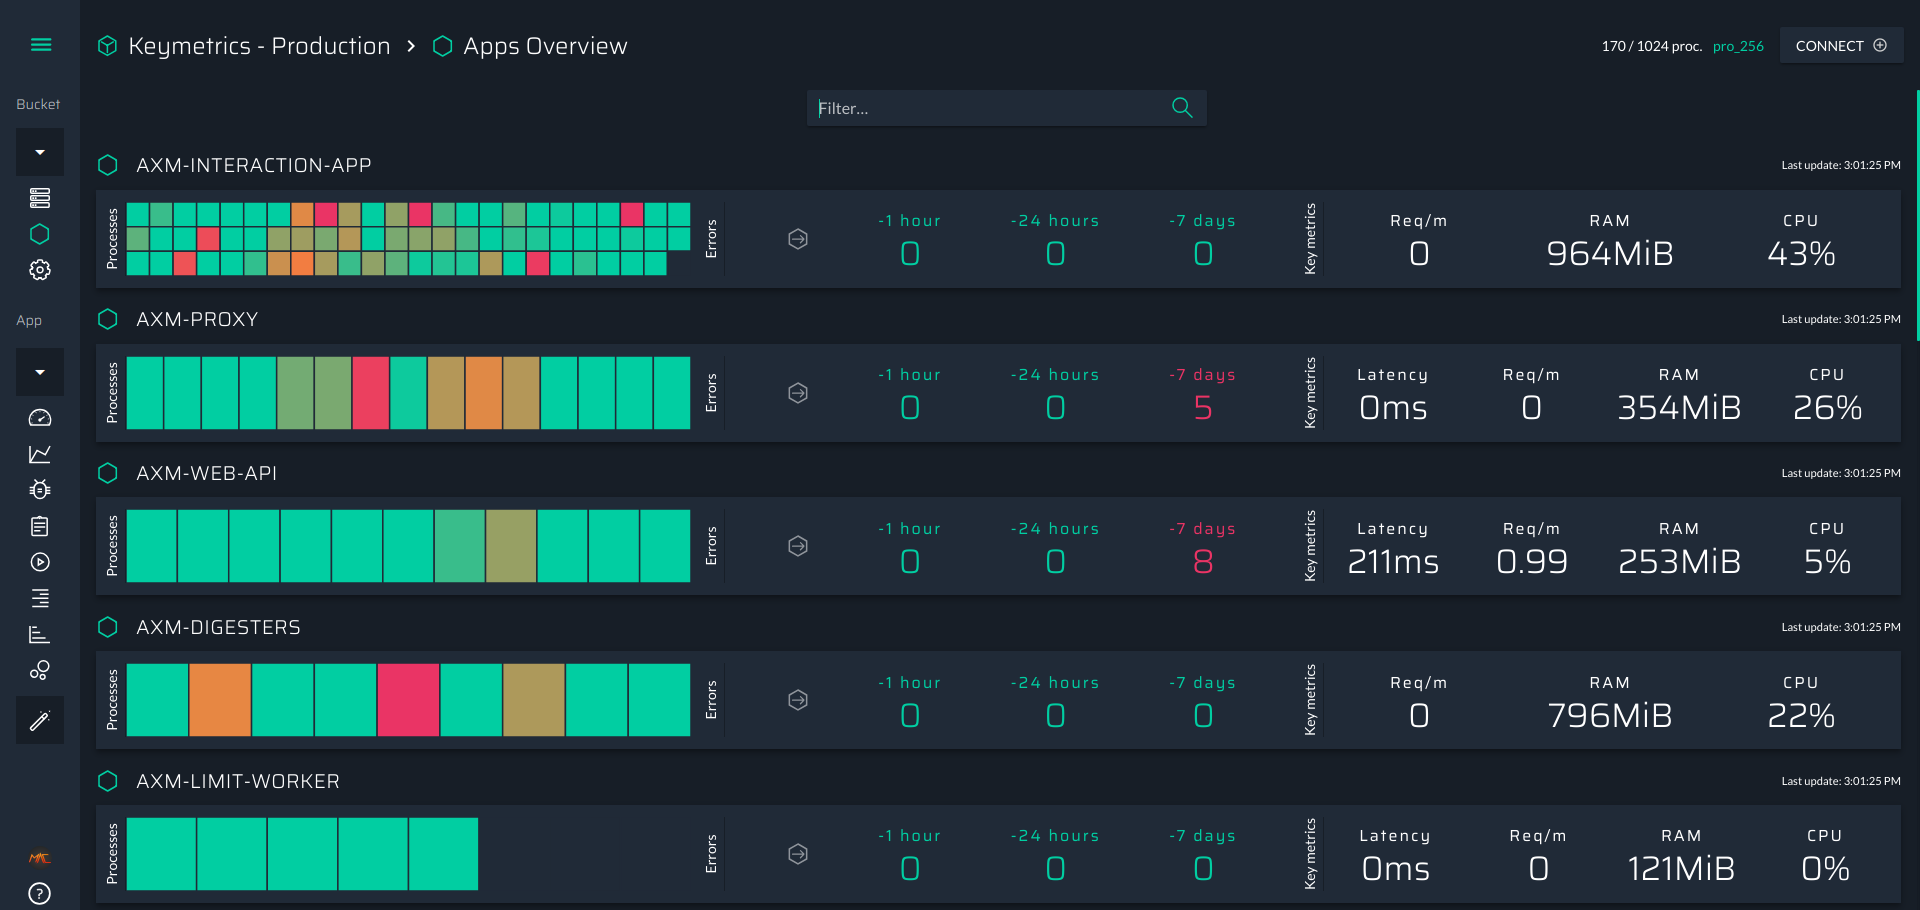
It contains almost everything you need to see to understand the current health of your applications:
- CPU Usage Heatmap
- Each cell represent a process in a server
- the color represent the cpu usage (varying from green to red where red is 100% of cpu usage)
- Error history
- Last hour, last day and last week, it give you an idea if the application is instable for a long time or not.
- Important metrics
- average cpu utilization
- average memory consumption
- average latency (only if you are using an http server)
- average Request / minutes (only if you are using an http server)
If you click on the heatmap, you will directly go on the app dashboad which is discribed in the following dashboard.