Memory profiling
Profiling tools help you diagnose memory issues in your application.
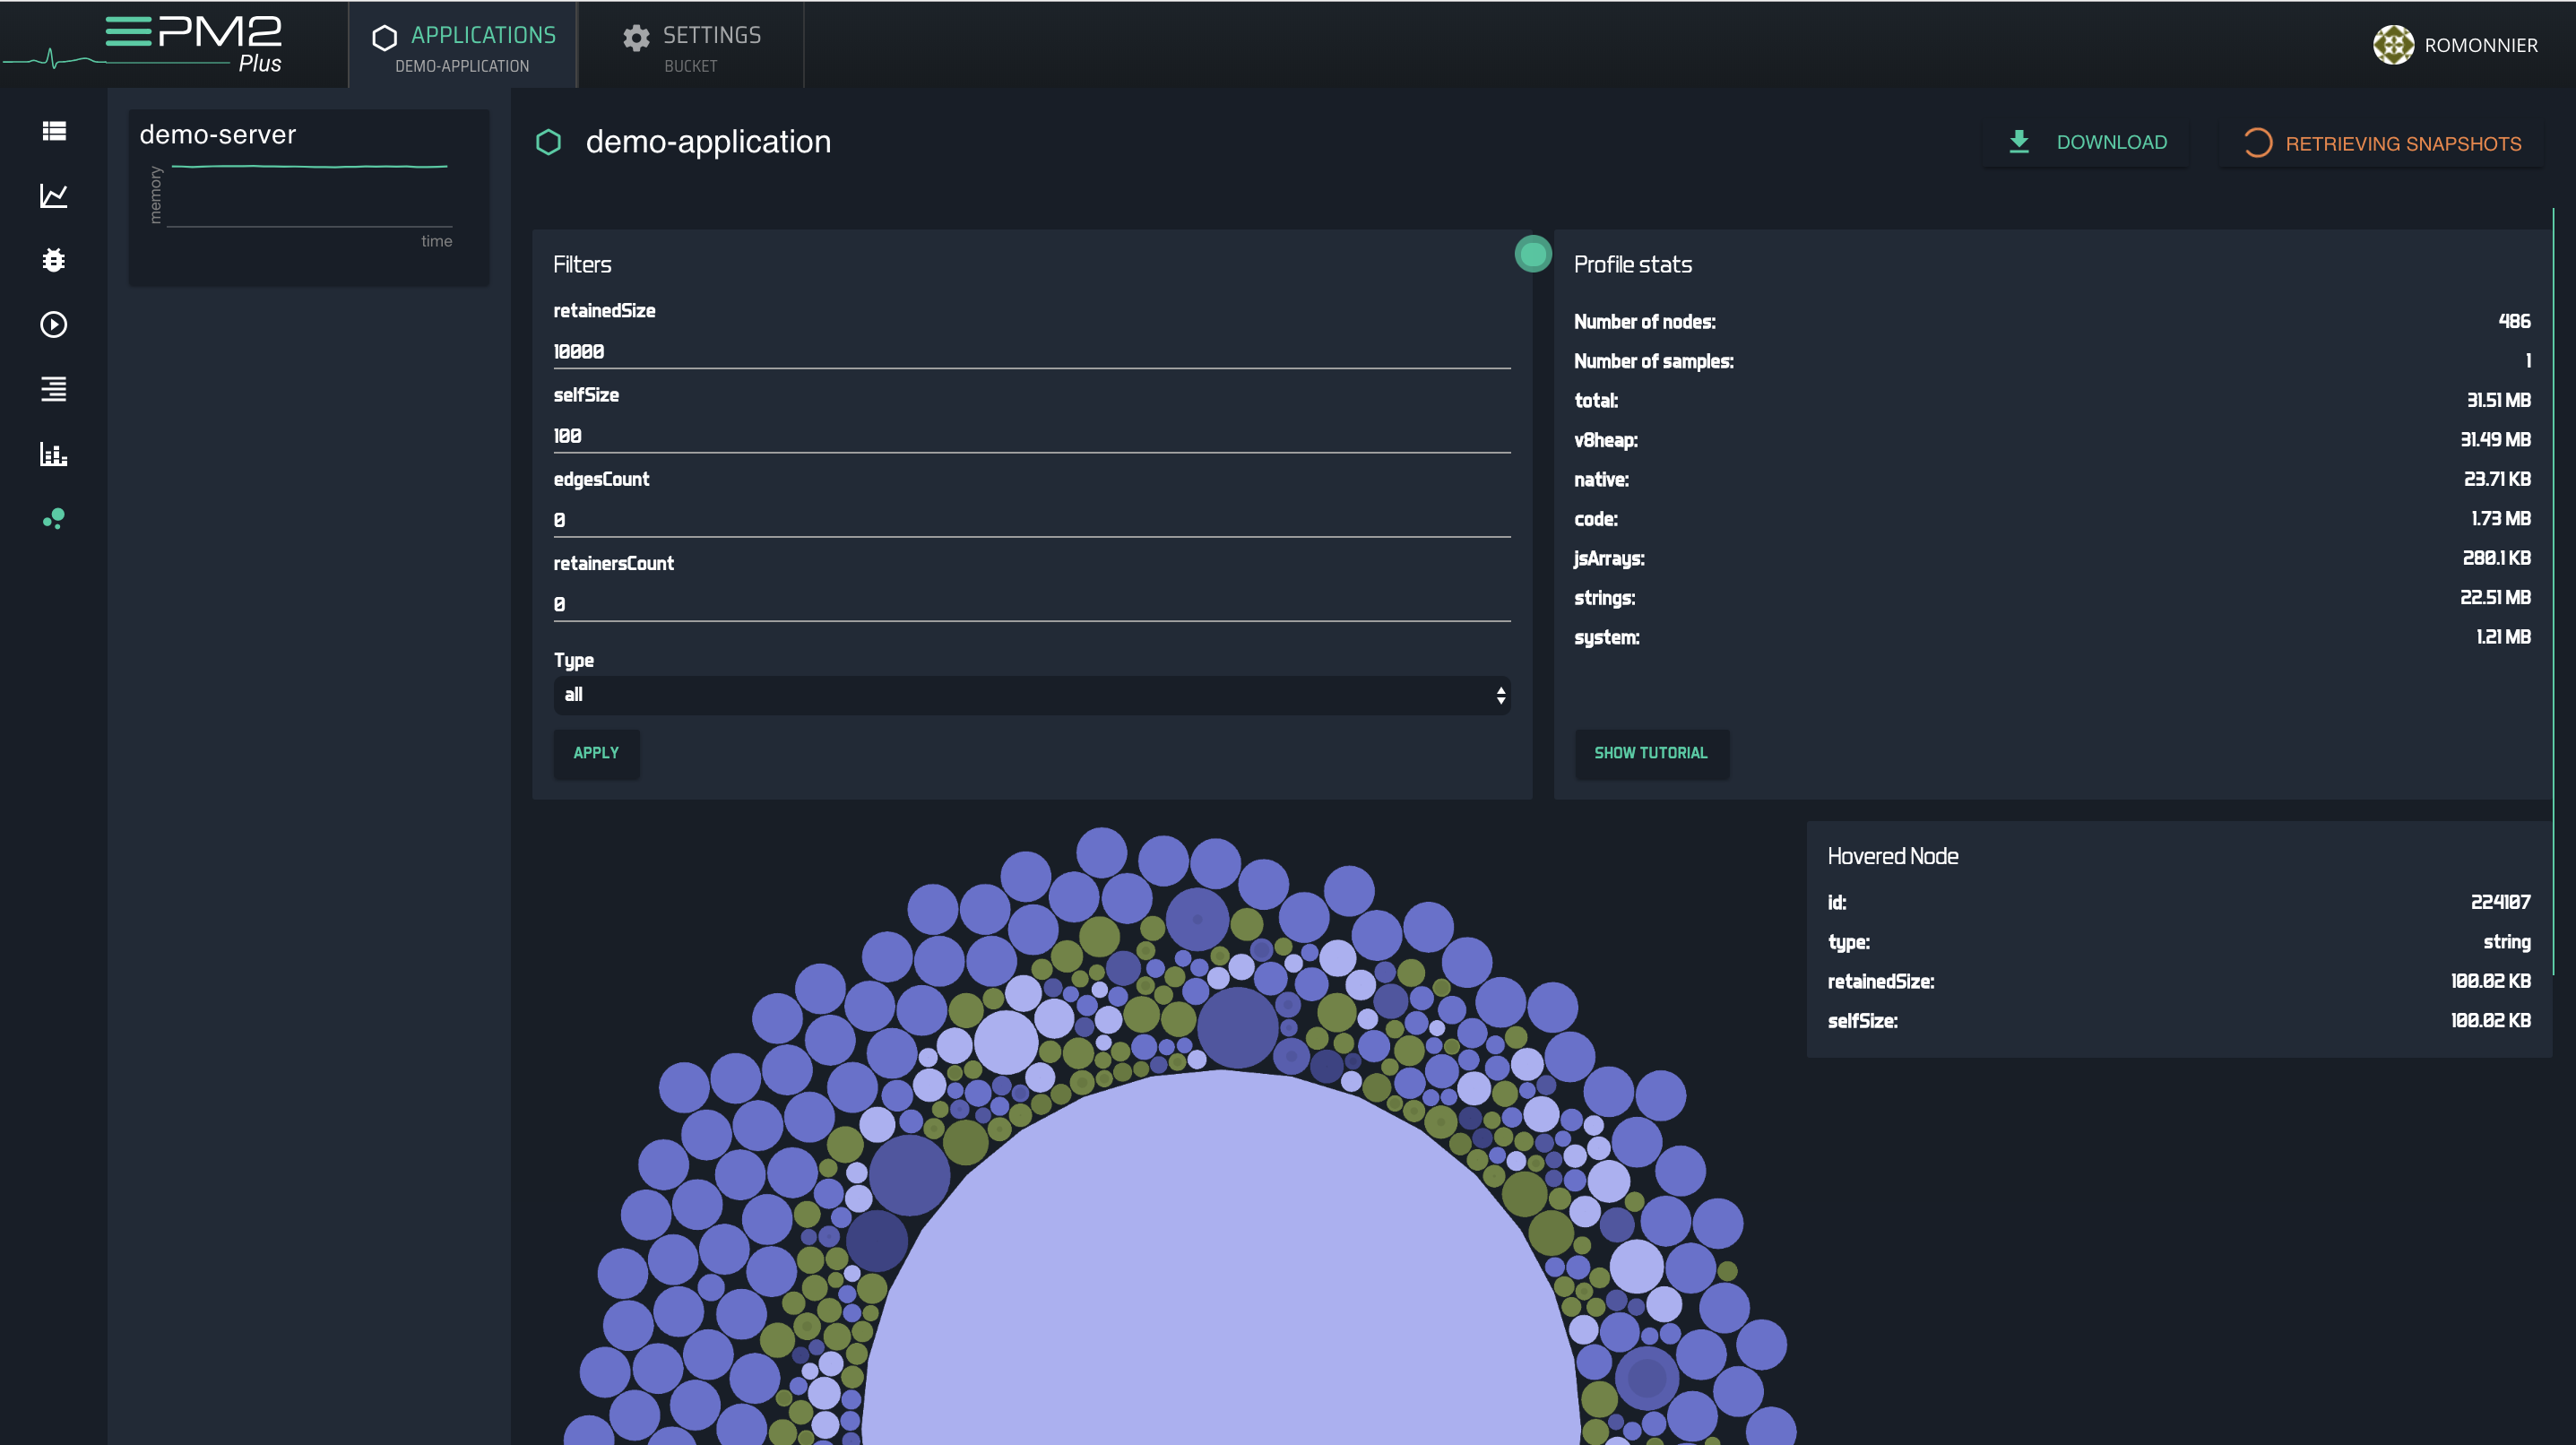
PM2 Plus allows you to take remote heap memory snapshots of your production servers and provide you visualization tools.
Memory profiling
In order to use the memory profiling, you must first install the profiling tool.
Click to take a heapdump and download the file. It may take some time depending on the weight of the heap file.
Inspect with the Google Chrome developer tool into the Profiles tab (Load button).
Tracking memory leaks
To track memory leak you will need to compare multiple heapdump files to see which element is increasing over time.
To know more about memory analysis check the google tutorial.