Overview
The profiling feature is a key feature that allow you to profile your applications at runtime. By profiling, we mean recording what’s your application is doing, either in term of cpu or memory, for that we have three profilers availables:
- CPU Profiler: Record how much time is spent in each function of your application
- Heap Profiler: Track heap allocation made by each function of your application
The power of both of the profilers are that you can profile your application remotely, without cost, straight in production. You don’t need to reproduce the problem in development anymore to pinpoint a memory leak for exemple.
All profiles are stored on our sides so you can easily access to them.
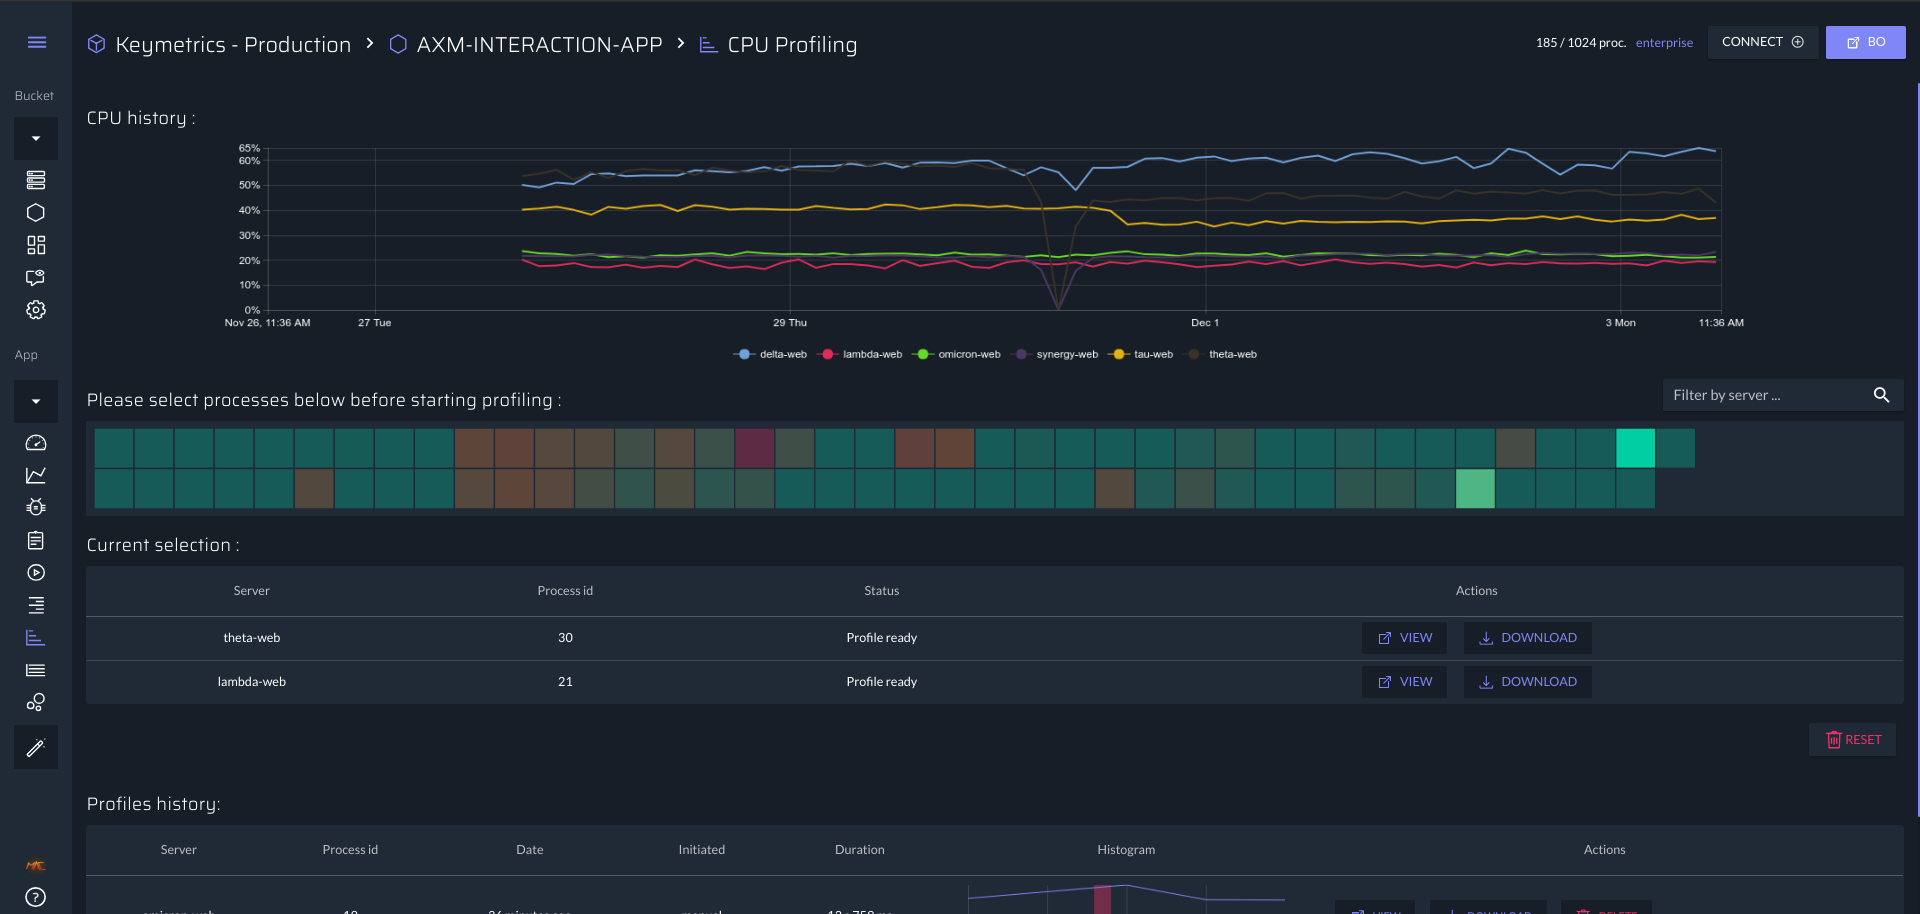
CPU Profiling
Interface to select which process to monitor:
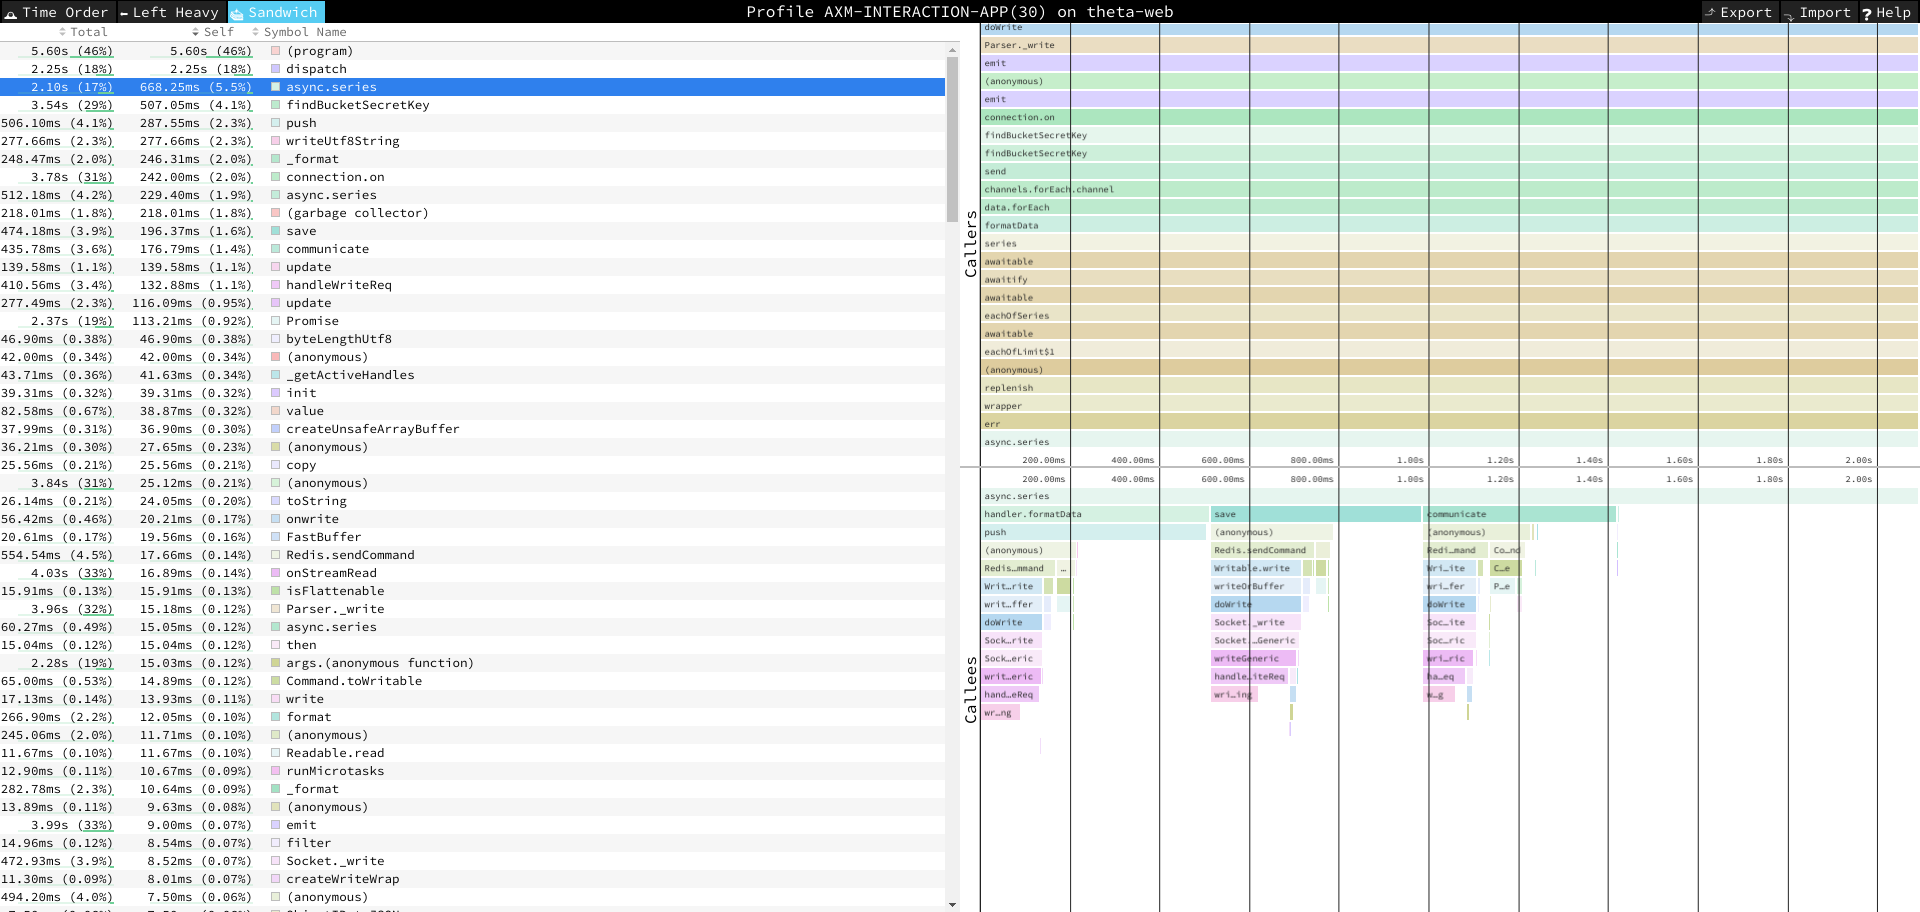
Debugging interface to detect slow functions:
Your application is using a lot of CPU in production but you don’t know why. You could try to modify your code in production but you don’t want to do that because it’s production. You could also try to replicate the issue in development but it’s really difficult to get the same traffic as in production.
Here the CPU profile comes in and allows to know which function is using the CPU, you just link your application with PM2 Enteprise and select it when you want to profile it.
Note that if the CPU Profile report a large amount of usage is done in the garbage collection, you might want to use the heap profiling to know what’s being allocated (and so what’s need to be GC’d a lot)
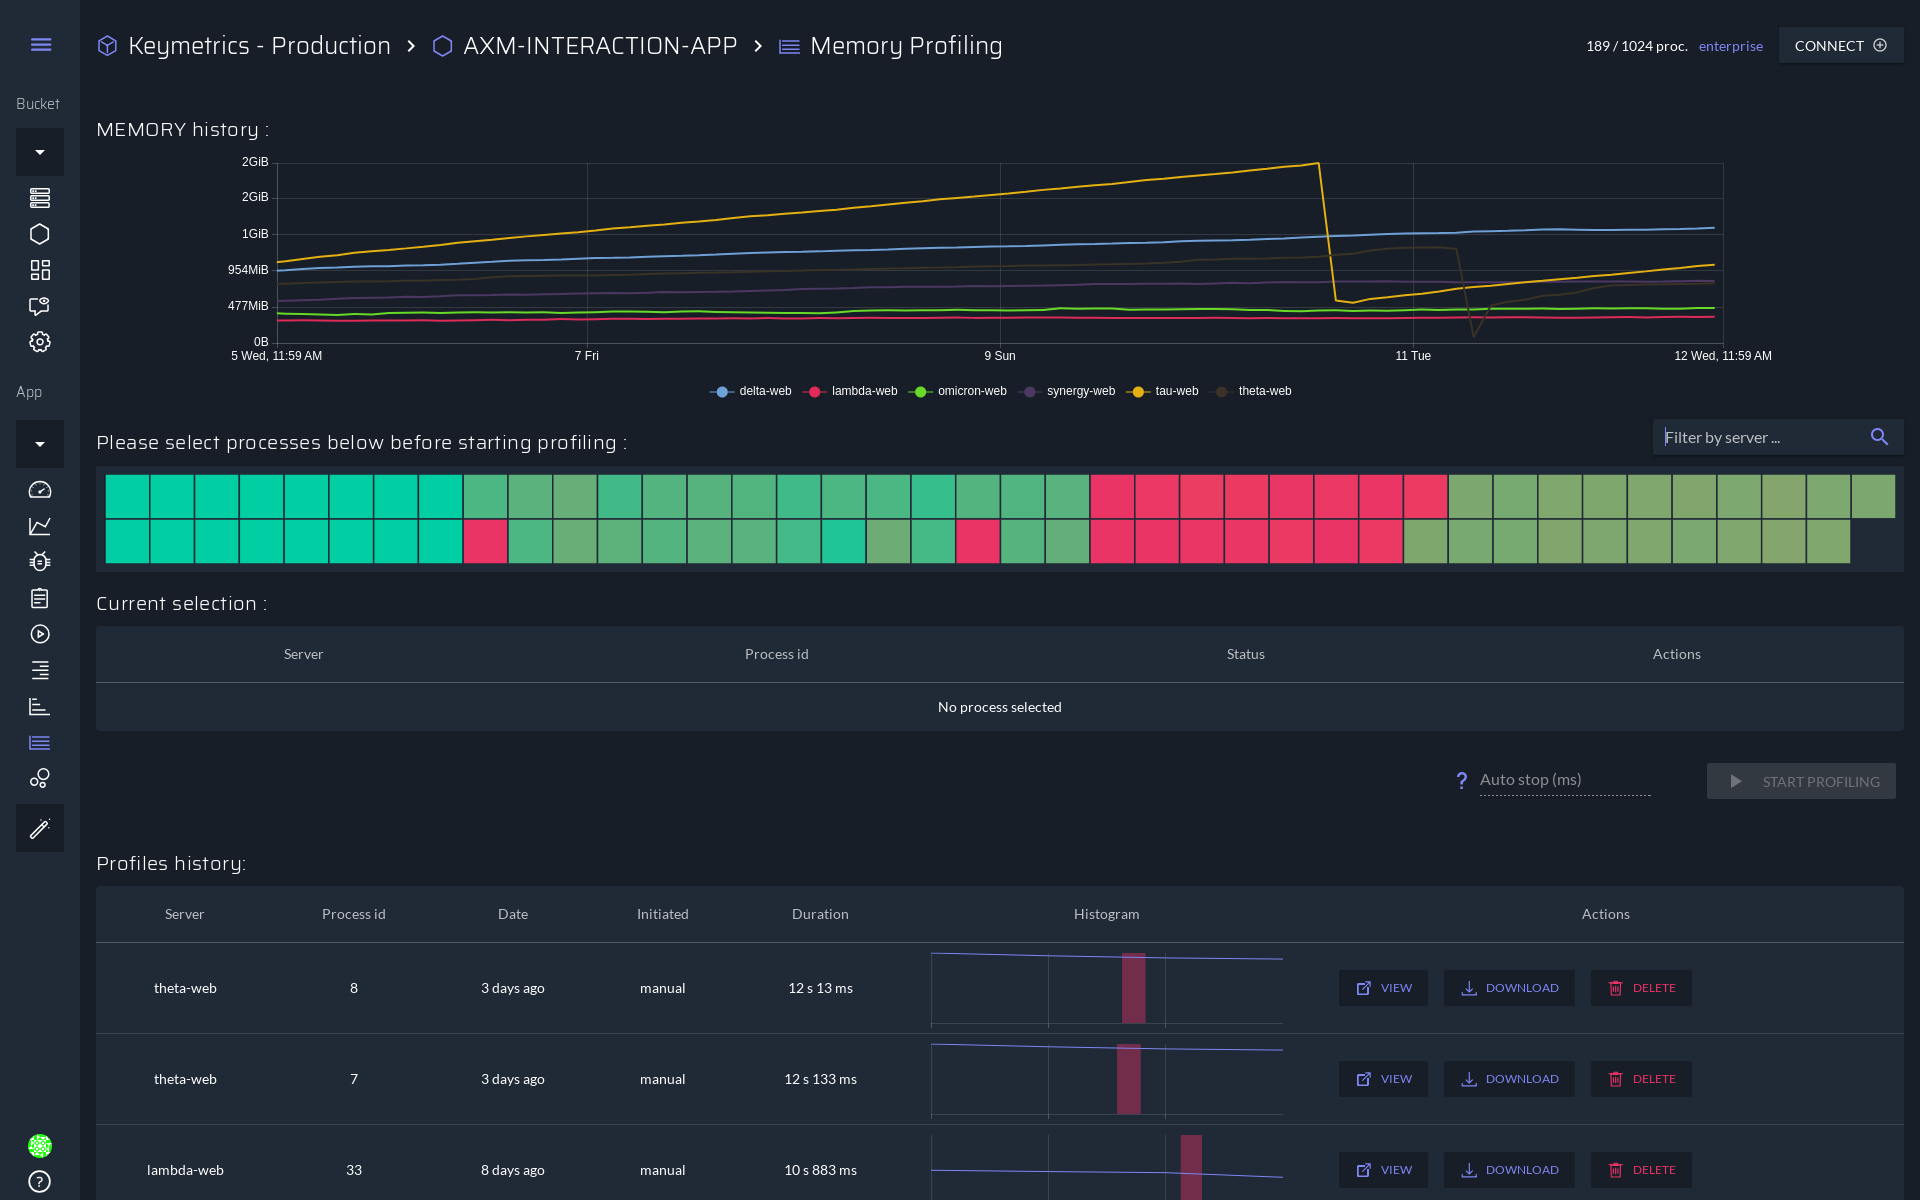
Heap Profiling
Interface to select which process to monitor:
Debugging interface to inspect memory usage:
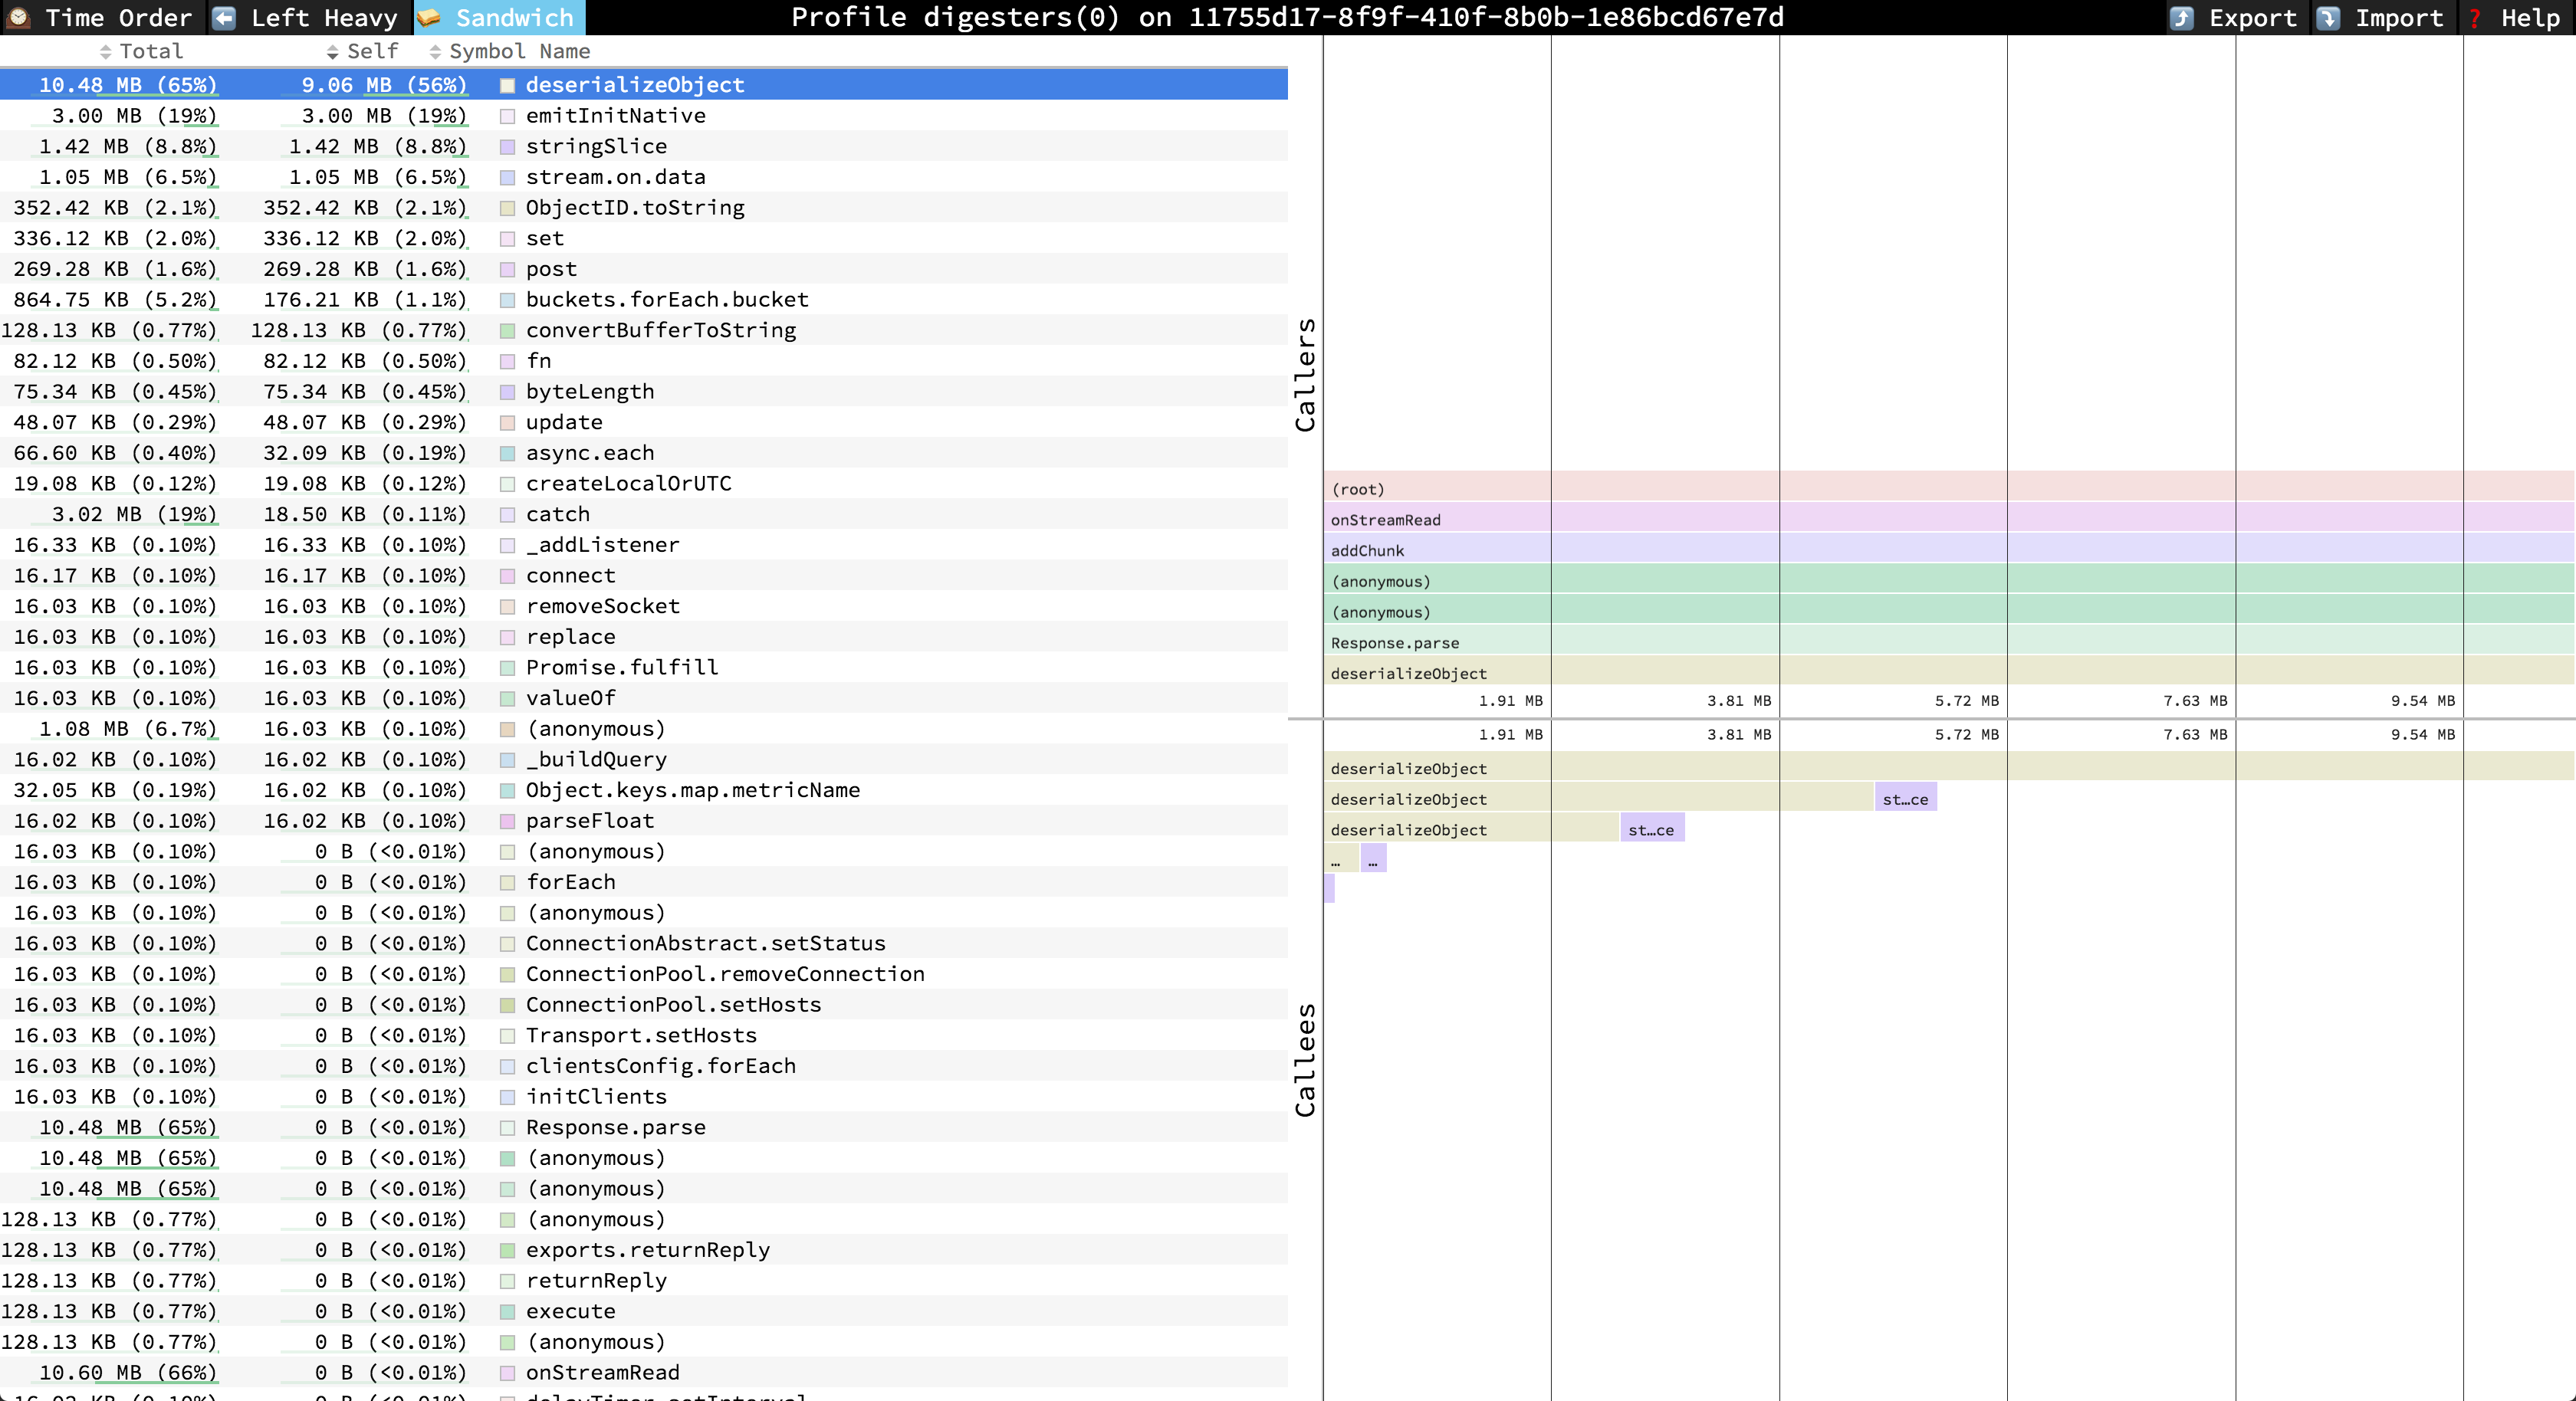
Almost the same case as the CPU profiler, you have a memory leak in production but it’s hard to replicate in development. You can rely on the heap profiler to tell you which function is allocating object.
Requirements
In the following documention, we assume that you already have connected your application to PM2 Enterprise (either on-premise or cloud).
Note that we expect you to know a bit about how to read a allocation / cpu timeline. You will be able to read the summary of a profile (because it just a list of functions with their cpu or memory usage) thought.
Configuration
Node.js
Starting from Node 10
When using Node 10, all profilers are available out of box without installing anything.
Node 8.X and 9.X
The profilers are available but you need to explicity enable them using the environement variable FORCE_INSPECTOR set to 1.
You have different way to enable them:
FORCE_INSPECTOR=1 pm2 reload app --update-env
In a persistent way:
echo "FORCE_INSPECTOR=1" >> /etc/environment
source /etc/environment
pm2 reload app --update-env
Or you can add it either inside your ecosystem.json file or your docker file.
For older version (Node 4, 6, 7)
NOTE: We advise to use the latest version of Node.js to profile your applications since the profilers are native and a lot more stable.
You must have g++ installed:
- For Linux, enter
sudo apt-get install build-essential. - For macOS, enter
g++in terminal and then follow the instructions.
Then you must install the addon used to profile your application:
pm2 install profiler
Then reload your application to enable the profiler:
pm2 reload all
Configure
After installing everything needed, you can control if you want it available or not within your code using @pm2/io:
const io = require('@pm2/io').init({
  // ...
  // your configuration, either standalone or with pm2
  // and then with this option you can control if the profiling
  profiling: true
})
Golang
All profilers are availables by default for our golang agent.
Best practices
Heap Snapshot for Node.js
Why is the Heap Snapshot not for production in Node.js?
- Its blocking your whole application from running, since you don’t want your heap to change while the snapshot is done.
- It will double the amount of memory used by your application (since you are doing a copy of the memory), so care with OOM killer.
- In specific condition, its known to be instable (mean it can crash your app):
- If your application use more than 500M of RAM, the snapshot might crash the application (see https://bugs.chromium.org/p/chromium/issues/detail?id=768355 and https://bugs.chromium.org/p/chromium/issues/detail?id=768355)
- In specific Node.js version, see this issue: https://github.com/Node.js/node/issues/23877
We are commited to fix the instability issue (note that the two first issue will always be there by design) but in the mean time we advise to only use the Heap Profiler in production.
How to use?
In the UI, you need to select the process you want to profile in the heatmap selector (a process color depend of this cpu usage for the cpu profiler and memory usage for the memory profiler).
At this point you have two choices:
- Automatically stop the profiling with the
timeoutbox (it require a version@pm2/ioabove 2.3 for Node.js) - Start manually, wait yourself the amount of time and then stop manually the profiling.
In either way, we advise to profile your application for more than 20-30 seconds depending if it’s heavy used or not. Since the profiler are running in parralel, it does’t track everything (which is call profile sampling), so you need to wait for your application to actually do different things to see them appear on the profile. Depending on the usage of the app, you might need to wait longer to see something interested in the profile (more than 5min).
Questions / Answers
-
Does it impact the performance of my application?
Apart from the Heap Snapshot (both go & Node.js), all profilers run in parralel of your application, so your application isn’t impacted.
-
What is the Total and Self Time in the CPU Profile?
The total time is the time spent in a specific function and all others functions that this function called. The self time is the opposite, only the time spent in a function without time spent by any functions that may have been called.
Common Issues
-
The Profiling returned an Timeout error !
You need to check if the connection is working between the agent and PM2 Enterprise. Note that the profiling can sometimes fail for a number of reasons, please contact us if it’s constantly failing for you.